
See the property behind the paperwork
Legal descriptions, surveys, and parcel data often conflict. Property Visualizer lets your team compare them in one place and see what actually applies on the ground.

Visualize the legal record to understand the property
Today, commercial real estate teams piece together the property from title documents, surveys, county GIS sites, assessor records, satellite imagery, and deed-plotting tools. Each source shows one piece, and none of them show how the descriptions, boundaries, and surrounding data relate to each other.
Orbital's Property Visualizer brings them onto one interactive map. Plot legal descriptions and surveys alongside tax parcels, zoning, and flood data, compare sources, reconcile differences, and identify issues sooner without moving between systems.
With Property Visualizer, real estate teams can:
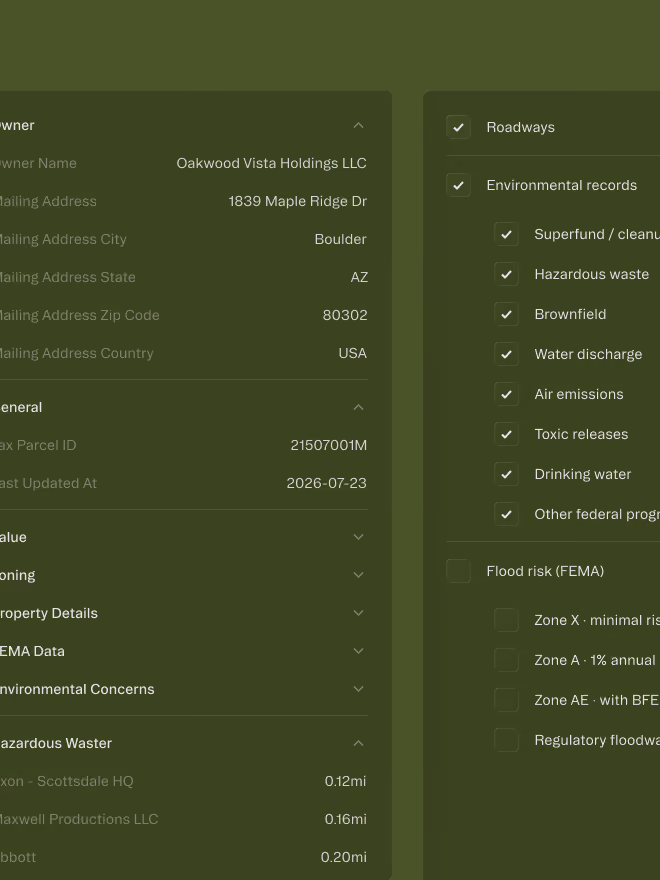
See the property in context
See the subject parcel against zoning, roadways, and other GIS map layers in one interactive screen.
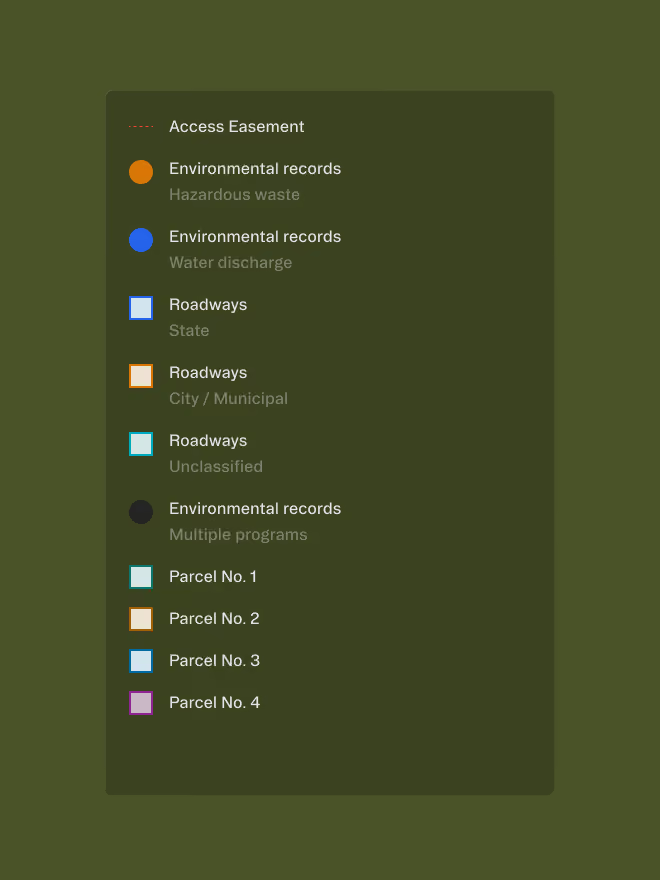
Understand what affects the parcel
Visualize the exceptions, easements, and rights of way. Get an early view before the survey arrives and compare it after it does.

Flag potential issues faster
Raise questions to the surveyor and flag potential issues to the parties that need to be addressed ahead of closing.

Explain advice more clearly
Turn findings into clear visuals that owners, lenders, counterparties, and deal teams can understand at a glance.
Plot legal descriptions
Read metes-and-bounds calls, PLSS aliquots, and lot-and-block subdivisions from your documents, and plot them on the map. Parcels, exceptions, easements, and rights of way become visual information your team can inspect and trace back to the source documents.

Visualize easements and exceptions against parcels
Plot easements, access rights, leased areas, restrictions, and utility corridors against the subject property. Teams can see where each interest sits, how it relates to the parcel boundary, and whether it could affect access, use, or development.

Map tax assessor data for adjacent and surrounding parcels
See the boundaries of all tax parcels on the map adjacent to and surrounding the subject parcel. Click to see the owner, parcel number, acreage, and assessed value details.
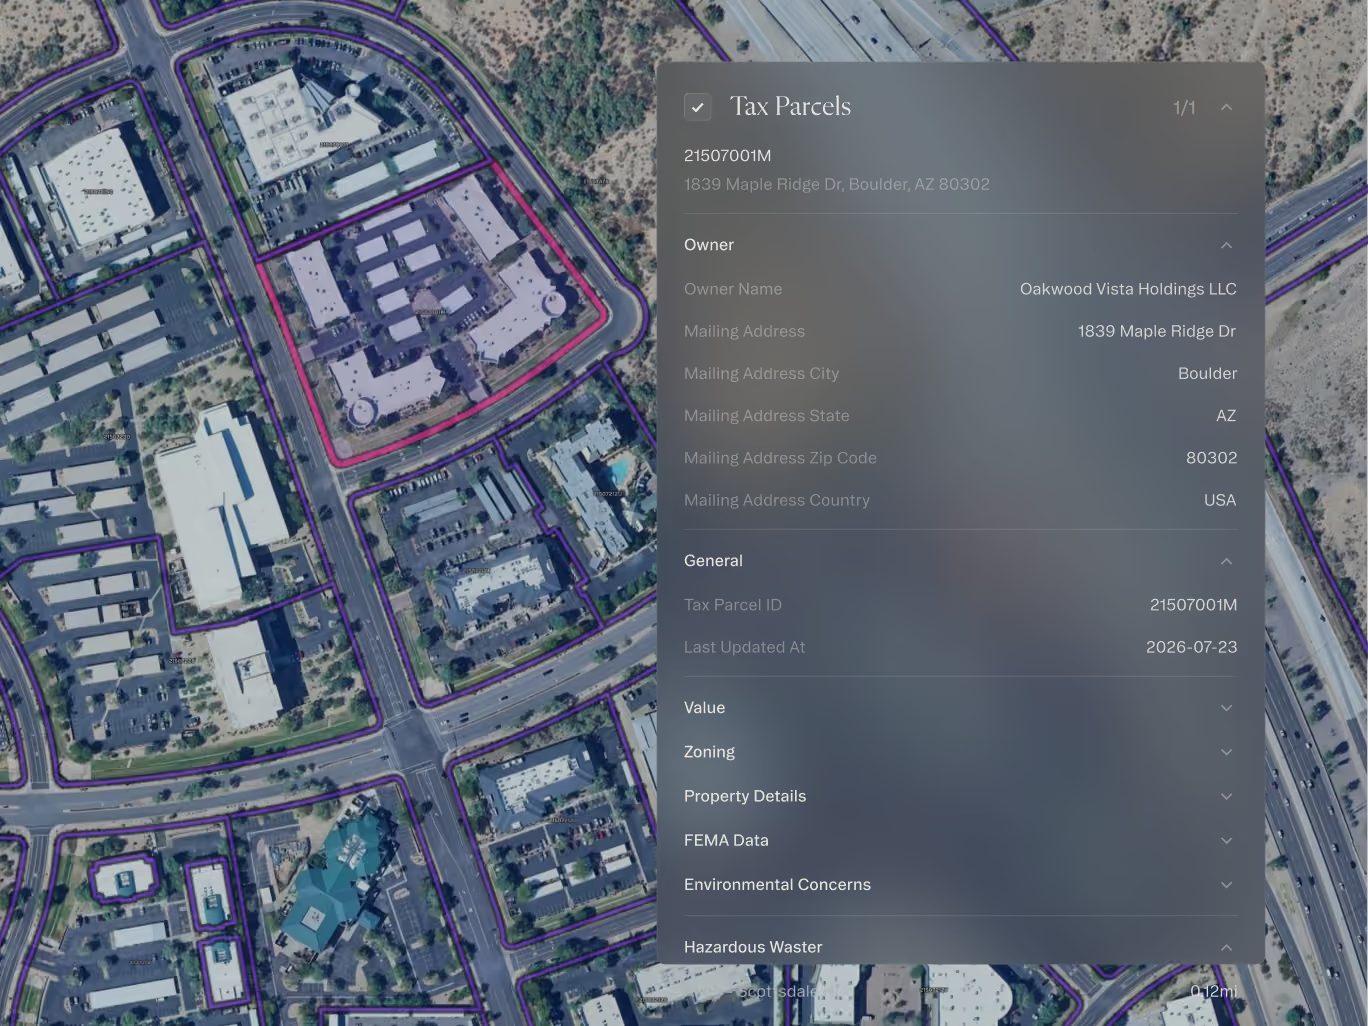
Toggle between GIS data layers
View current and future land use data, private and public roadways, FEMA flood screening, EPA environmental records (federal), and more.

Overlay surveys and plat maps
When the survey arrives, overlay it on the map and visually inspect it against the parcel, any easements and exceptions already plotted, and compare against plat maps and recorded plans.

Turn mapped findings into clear visual work product
Trace plotted layers back to their source records, flag legal descriptions that do not close, and add notes, labels, and shapes to the map. Export a clean visual for colleagues, internal teams, and clients.

Flag differences between legal descriptions
When multiple source documents contain the same legal description for a parcel, Property Visualizer groups them and displays a single primary description on the map to reduce clutter. Any differences are flagged, and the tax parcel is compared as an additional reference point.
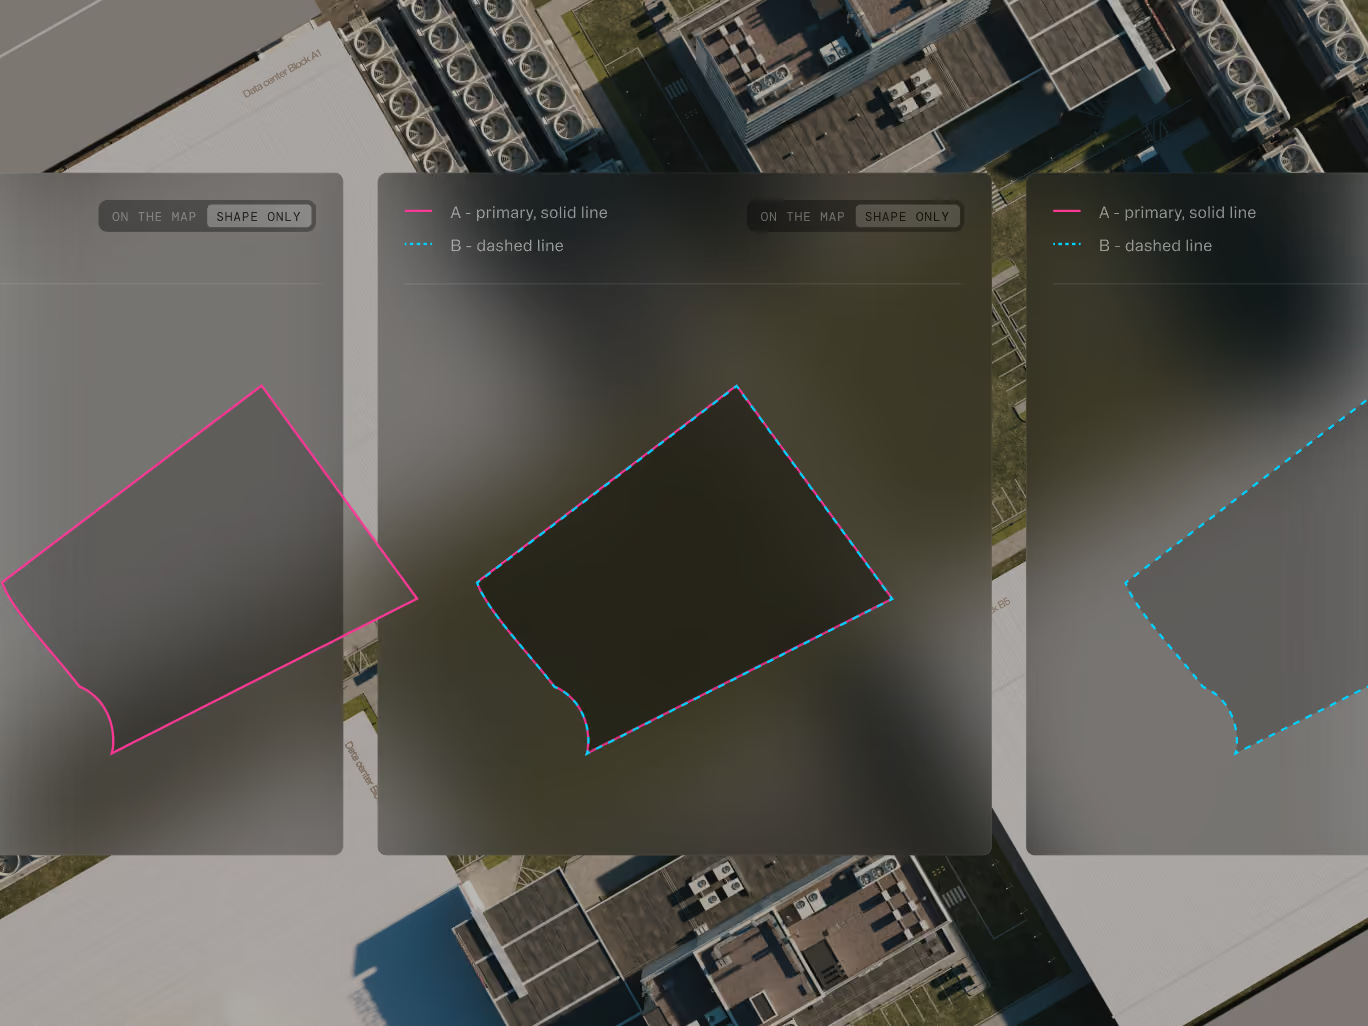
See property risk in the context of the deal

Understand what could affect the property before key decisions are made. Plot the property, exceptions, easements, and access against zoning, flood maps, and surrounding parcels to support due diligence, negotiation and financing.
Compare the legal record, survey, and property view in one place. Plot descriptions, overlay surveys and plats, and see where boundaries, exceptions, or descriptions require further review.
Understand the premises, access, and restrictions in context. Visualize leased areas, parking, access, rights of way, easements, and adjacent parcels before signing, advising, or escalating an issue.
Assess the physical and regulatory context of a potential site. Layer parcel boundaries, ownership, access, zoning, flood data, environmental records, and easements to identify opportunities and constraints before capital is committed.
Frequently asked questions
How is Property Visualizer different from a deed plotter?
A deed plotter draws one description in isolation, while a generic map shows you parcels and ownership. Property Visualizer reads the legal descriptions and exceptions from your own deal documents, reconciles which version of the parcel governs, plots them against the subject and surrounding parcels, overlays your survey, and traces every plotted description back to its source.
How is Property Visualizer different from a GIS system?
A GIS platform can show layers such as zoning and environmental data, but not in the context of the legal descriptions in your deal documents. Property Visualizer works from the documents in your file, showing the property the transaction actually describes alongside the relevant map layers.
When the same parcel is described more than once, how does Property Visualizer decide which is right?
It brings the versions together, marks the primary as the title commitment or the last vesting deed and keeps the alternates, then shows you where they differ. You can set which legal description should be the primary version. It keeps to the words in the documents and does not change their legal standing.
Can I see where the plotted legal descriptions and data sources come from?
Yes, every plotted legal description cites the source document. Each GIS map layer names its source in the terms you use: tax assessor records, the survey, the deed. When it cannot place a description on its own, you place it. The survey remains the authority.
Does Property Visualizer plot different types of legal descriptions?
Property Visualizer plots metes-and-bounds, lot-and-block, and PLSS descriptions, including descriptions that combine more than one system. When a legal description hangs off a geodetic marker it was never given (e.g. a stake, a tree, or a monument), it plots the polygon which can then be manually placed.